Get hands-on help with Vocordia
Employees can follow this guide step by step - or open a ticket and wait for support.
Or they can finish inside the app.
Vocordia gives voice and cursor guidance directly inside the tools they already use - just say what they need, and Vocordia shows them where to click, step by step, without leaving the window.
How to Create a Pivot Table in Excel
Pivot Tables summarize large datasets quickly - totals, averages, counts - without writing complex formulas. Start from a clean table with column headers.
Prepare your source data
- Use a single header row with unique column names.
- Avoid blank header cells; remove fully blank rows/columns inside the dataset when possible.
- Prefer an Excel Table (Insert → Table) so new rows are included when you refresh.
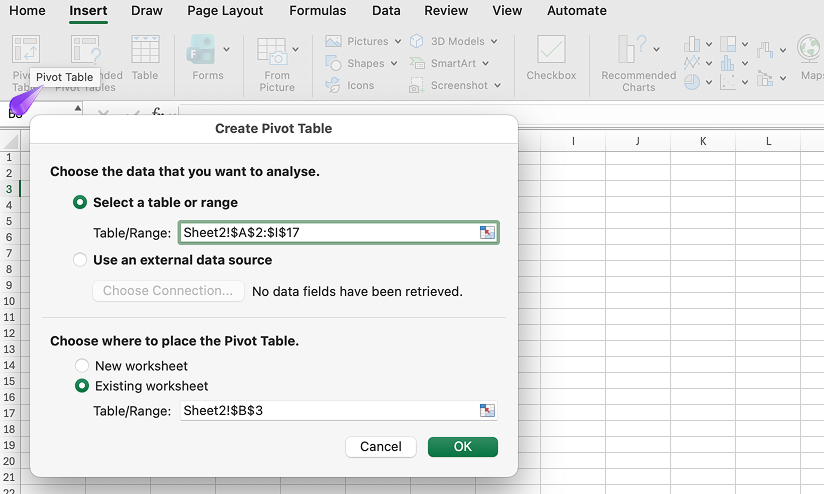
Insert a PivotTable
- Click anywhere in your data.
- Go to Insert → PivotTable.
- Confirm the range/table and choose whether to place the PivotTable on a new worksheet or an existing location.
- Click OK.
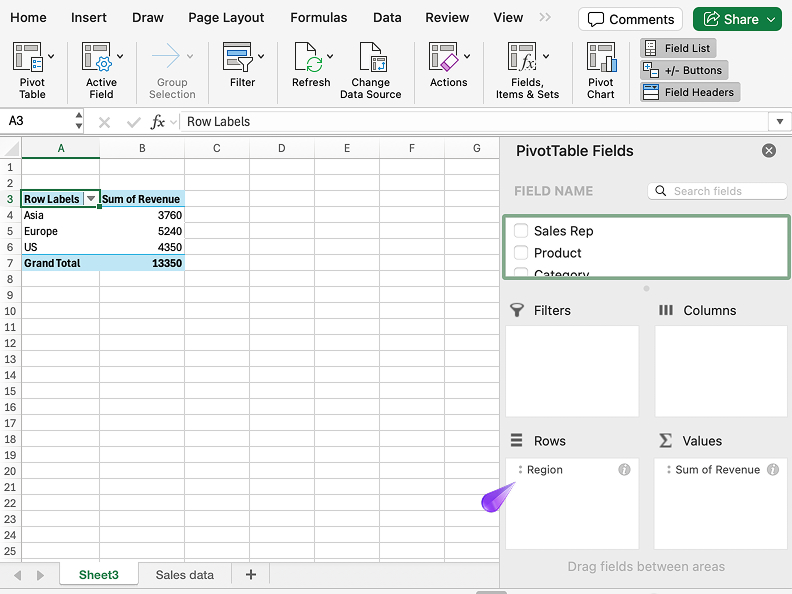
Build the report
- In the PivotTable Fields pane, drag fields into Rows, Columns, Filters, and Values.
- For numeric fields, open the value field settings to switch between Sum, Count, Average, etc.
- Use filters and slicers to slice the summary interactively.
Refresh when data changes
Right-click the PivotTable → Refresh, or use Data → Refresh All. If your source is a Table, refreshing picks up new rows reliably.
Try it faster with guidance
Skip the manual steps—let Vocordia guide you through it with voice and step-by-step cursor guidance so you can place fields and formats without hunting menus.
Still routing this to IT or HR?
There's a faster way.
Next time, employees can ask by voice and get step-by-step guidance inside the app - no manual, no ticket.